

The challenge

The Camelyon Challenge is organized by a group of researchers (from Radbound UMC, UMC Utrecht and TU Eindhoven in conjunction with the ISBI (International Symposium on Biomedical Imaging) and will run for two years. It is the first challenge using whole-slide images in histopathology. The goal is to evaluate new and existing algorithms for automated detection of metastases in hematoxylin and eosin (H&E) stained whole-slide images of lymph node sections.
This task has a high clinical relevance and requires large amounts of reading time from pathologists. A successful solution could help to reduce the workload of the pathologists, reduce the subjectivity in diagnosis and lower the cost of the diagnosis. The 2016 challenge focuses on the detection of sentinel lymph nodes of breast cancer. The data sets provided by the Radboud University Medical Center (Nijmegen, the Netherlands) and the University Medical Center Utrecht (Utrecht, the Netherlands) consist of 400 annotated whole slide images, thereof 270 training images and 130 test images. The images have been exhaustively annotated, the average annotation time was 1 hours. The first round of the challenge was completed with a challenge workshop held at ISBI 16 on April 13th. The submission page was reopened on April 14 for new submissions.

FIRST RESULTS
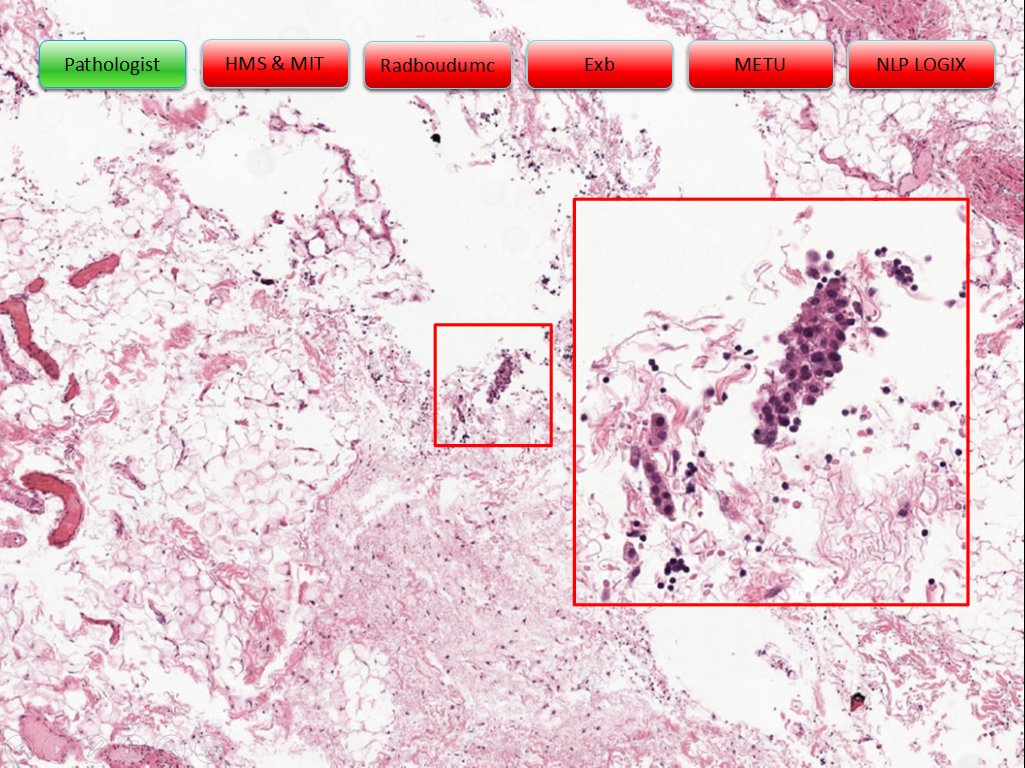
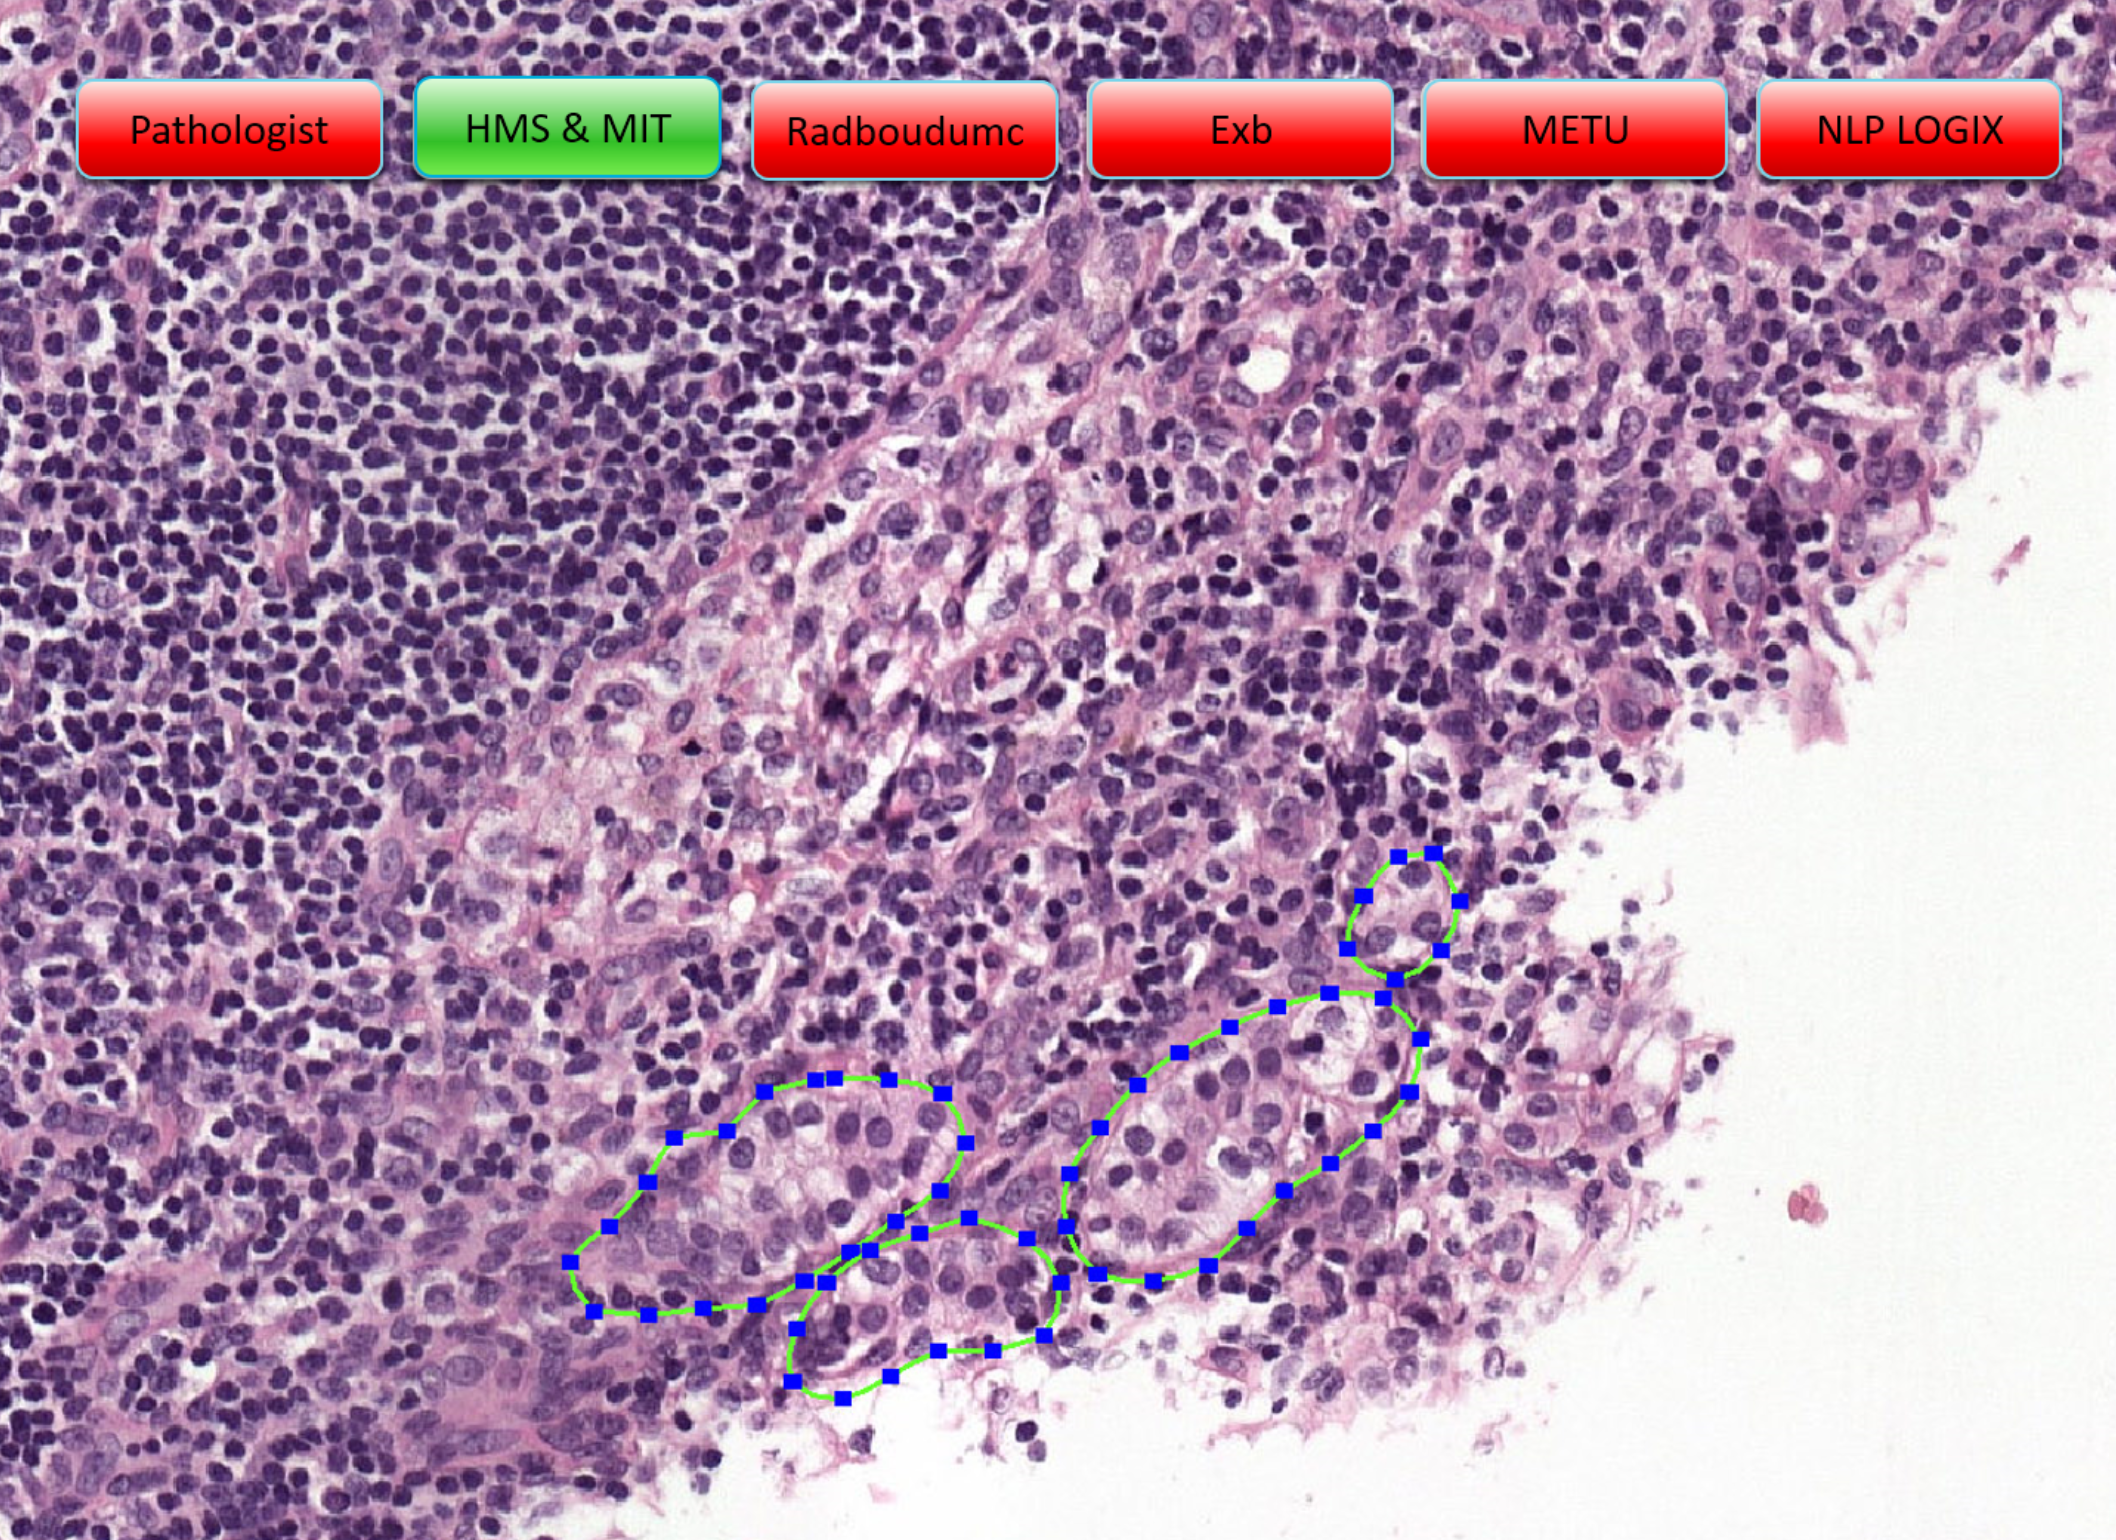
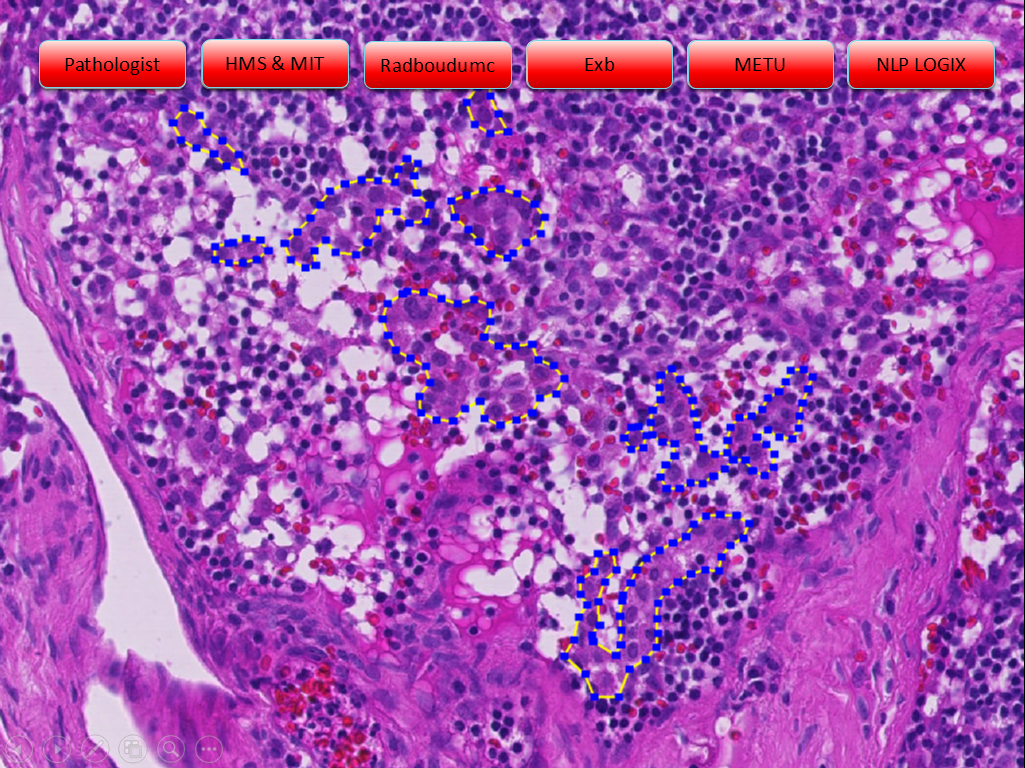
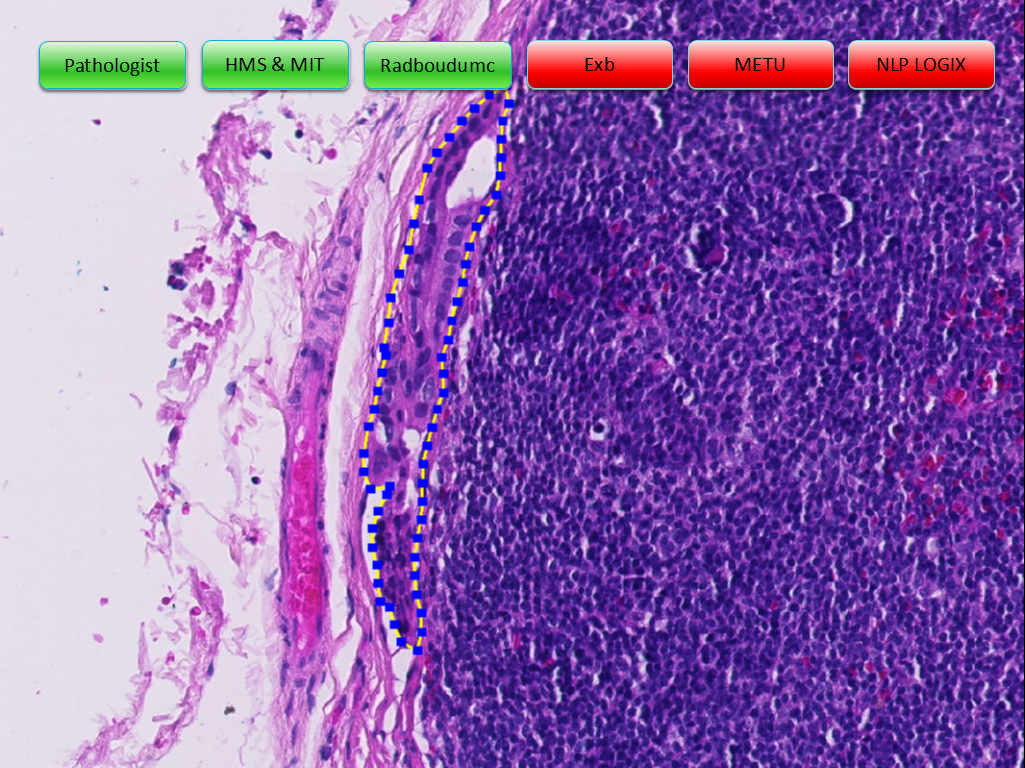
Example slides from the challenge (click arrows to view all slides), Source: "Statistics, Leaderboards, Results and Comparison to Pathologist", presented at ISBI 2016 by Babak Ehteshami Bejnordi
As of July 26th there have been 25 submissions. Submissions are evaluated both by slide and by lesion. The ranking for whole slide classification is created by performing a receiver operating characteristic (ROC) analysis. The measure used for comparing the algorithms will be area under the ROC curve (AUC). ROC curve is the plot of the true positive rate (or sensitivity) versus false positive rate. The ranking for the tumor localization based on a free-response receiver operating characteristic (FROC) curve. The FROC curve is defined as the plot of sensitivity versus the average number of false-positives per image. Results are published in two leaderboards on the challenge website. Both leaderboards are currently lead by a team from Harvard Medical School and MIT with an AUC of 0.92 for the whole slide classification (1) and of 0.7051 for the tumor localization (2), followed by EXB Research and Development co., Germany and the Chinese University of Hong Kong (CU lab), Hong Kong (Leaderboard 1) and Radboud University Medical Center (DIAG), Netherlands and the Chinese University of Hong Kong (CU lab) (Leaderboard 2).
What do these values actually mean?
The AUC measures the area under this curve and is a commonly used measure in the machine learning community to compare models. The AUC of a classifier is equivalent to the probability that the classifier will rank a randomly chosen positive instance higher than a randomly chosen negative instance (assuming positive ranks higher than negative). The closer the ROC gets to the optimal point of perfect prediction the closer the AUC gets to 1. The leading solution submitted by HMS/MIT achieved an AUC value of 0.92 which is only 0.04 points short of the value of 0.96 that was achieved by a human pathologist. Combining the pathologist's analysis with the two best submitted methods the AUC value reaches 0.99, what would lead to a significant reduction of error in cancer diagnosis.
Image classification error of the Imagenet challenge winning systems vs. human benchmark
Is it just a question of time until algorithms beat the human eye?
Looking into the results of the Imagenet Large Scale Visual Recognition Challenge, a competition with classification and localization tasks on a test data set of 150.000 images that was held since 2010, this question can be answered with yes. The winning system of the 2015 challenge from Microsoft had a classification error rate of 3.5 % beating the human benchmark of 5.1% for the first time.
It looks like the organizers of the Camelyon Challenge are convinced there is still potential in cancer recognition on histopathological images, as they reopened the submissions page the day after the workshop at ISBI 2016 on April 13th. The ranking is updated as new methods are submitted. So it’s definitely worth keeping an eye on it. The Camelyon 17 Challenge will be held in conjunction with the ISBI 2017 in Melbourne, Australia.
One of the goals of the challenge was to find solutions for a problem with high relevance in clinical practice and evaluate their performance in standardized, quantified and reproducible from. Apart from leaderboards and numbers the most exciting question will be how and when these methods can be implemented into clinical routines to really improve cancer diagnosis and patient care.
"Three years ago when we started developing algorithms for detecting lymph node metastases of breast cancer, many pathologists in our hospital considered the task nearly impossible for computers, as they believe it's a very complex visual task. The results of Camelyon16 challenge, However, showed that the state-of-the-art artificial intelligence techniques achieve near-human performance in diagnosing breast cancer. While these results are very promising, before introducing these systems into routine clinical practice, we have to validate them rigorously on large number of samples. Camelyon 17 challenge would be a major step towards reaching this objective. We are going to provide participants with a much larger multi-center data set to train and test their systems. As a result of next year's challenge, I would envision a number of algorithms that not only produce accurate and reproducible results but also outperform anatomic pathologists in routine diagnostic settings." - Babak Ehteshami Bejnordi, Radboud University Medical Center, lead coordinator of the Camelyon Challenge
More Information
Background information, rules and the leaderboards with all results can be found on the Challenge's Website: http://camelyon16.grand-challenge.org/
Imagenet Large Scale Visual Recognition Challenge 2015: http://image-net.org/challenges/LSVRC/2015/index
Olga Russakovsky, Jia Deng et al (2016): ImageNet Large Scale Visual Recognition Challenge, International Journal of Computer Vision (IJCV), 2015, http://hci.stanford.edu/publications/2015/scenegraphs/imagenet-challenge.pdf